In early February, I lost track of Cryptovoxels. Prior to February, I had visited every build after it was done, and I was pretty sure I’d seen 99% of what was in the city.
In February, everything sped up so much that I just have no idea what’s in the city now, other than watching what appears in the #builds channel on discord, and what @cryptovoxels1 tweets.
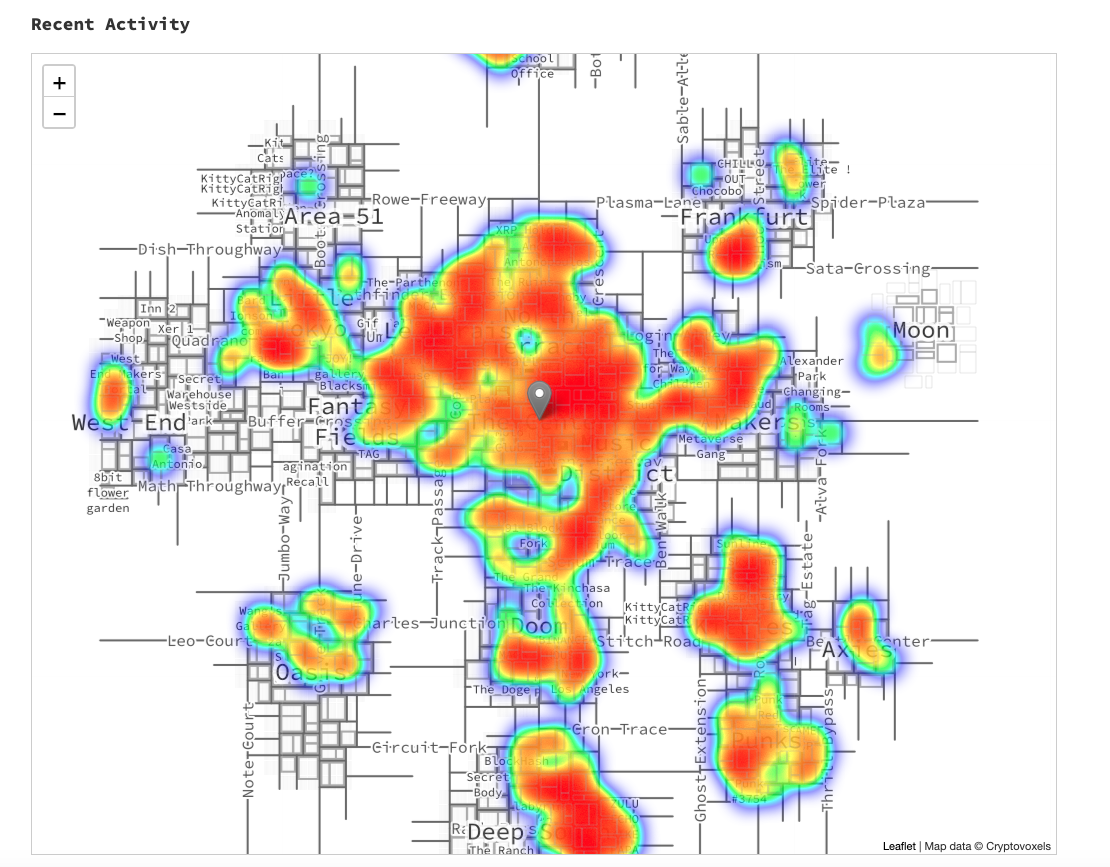
Like everyone, I needed a way to see what is popular in the world. So, last night I turned on a visitor tracking system, that keeps tracks of which parcels are visited by people walking around. These are all put in a database, and then I generate a heatmap.
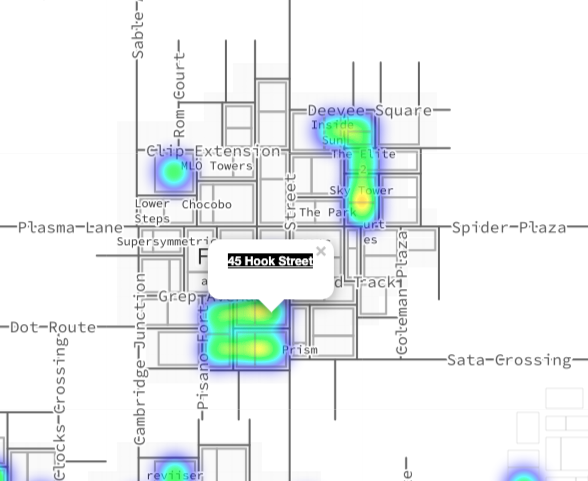
The heatmap shows darker, more red spots, wherever people are visiting the most. You can zoom in on the map to see which parcels are popular. I also overlay the parcel grid, so you can click on a dot of activity and then visit the parcel. For example, here’s some of the visitors to Frankfurt:
I’m going to do more with this data, putting sparklines on individual parcels, as well as traffic stats, and also providing a database export so that people can do analysis. It may help people in deciding which neighborhoods to buy into. The traffic analysis is especially interesting in the secondary market, because you can see which neighborhoods have a thriving community.
 twitter
 instagram
 github
 atom feed
 json feed